GRC Dashboards for Board Reporting and Decisions
Rudramuni Swamy H M | 13 Feb 2026 | Not Modified
In an environment defined by regulatory scrutiny, cyber threats, operational volatility, and stakeholder pressure, governance, risk, and compliance (GRC) is no longer a back-office function. It is a strategic discipline. And strategy demands clarity.
When oversight bodies ask, “Where do we stand?” They are not looking for raw data, spreadsheets, or fragmented updates from risk, compliance, audit, and IT. They are looking for concise, defensible, and business-aligned insight.
This is where GRC dashboards for board reporting become indispensable.
Modern GRC dashboards transform complex risk and compliance landscapes into structured, decision-ready intelligence. They bridge the gap between operational controls and strategic governance. When designed correctly, they enable sharper conversations, faster decisions, and stronger organizational resilience.
Why GRC Dashboards for Board Reporting Now Matter
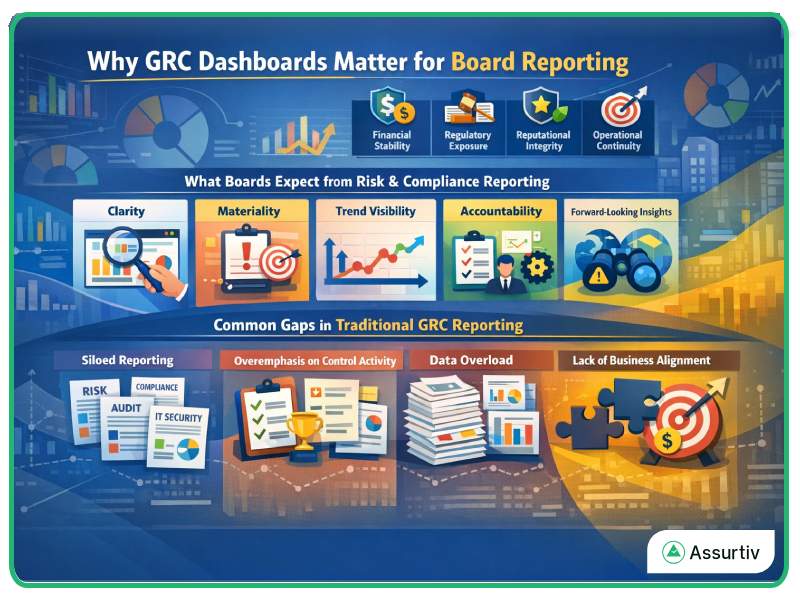
What Board Management Expect from Risk and Compliance Reporting
Oversight committees are not interested in operational minutiae. They are accountable for enterprise-level outcomes:
- Financial stability
- Regulatory exposure
- Reputational integrity
- Operational continuity
- Strategic growth
What they expect from GRC reporting for executives includes:
Clarity – A clear view of enterprise risk posture.
Materiality – Focus on risks that materially impact strategic objectives.
Trend visibility – Whether exposure is increasing, decreasing, or stable.
Accountability – Clear ownership and remediation status.
Forward-looking insights – Emerging threats and predictive indicators.
Traditional risk reports often answer the question: “What happened?”
Effective risk dashboards for senior management answer:
- What is our current exposure?
- How does it compare to our risk appetite?
- What decisions are required?
- What is the potential business impact?
A board-level GRC dashboard should function as a strategic navigation system, not a data archive.
Common Gaps in Traditional GRC Reporting
Many organizations struggle with reporting maturity. Common gaps include:
1. Siloed Reporting
Risk, compliance, audit, IT security, and operational resilience teams produce separate reports. These lack integration and do not present a unified risk view.
2. Overemphasis on Control Activity
Reporting often focuses on:
- Number of policies updated
- Number of audits conducted
- Training completion rates
While important, these are activity metrics — not exposure to metrics.
3. Data Overload
Long PDF decks with dozens of pages overwhelm decision-makers. Without context, more data creates less clarity.
4. Lack of Business Alignment
Risk metrics are rarely mapped to strategic objectives, revenue streams, or critical assets.
Without a structured GRC dashboard for board reporting, oversight becomes reactive instead of proactive.
Key Metrics in GRC Dashboards for Senior-level Management
An effective dashboard is not about quantity. It is about relevance.
Risk, Compliance, and Audit KPIs That Matter
The most effective GRC KPIs for leadership fall into five categories:
Enterprise Risk Metrics
- Top 10 enterprise risks (by impact and likelihood)
- Residual risk vs inherent risk comparison
- Risk heat maps across business units
- Risk appetite threshold breaches
- Emerging risk indicators
These board reporting risk metrics should focus on:
- Financial exposure
- Operational downtime potential
- Regulatory penalties
- Data breach impact
- Supply chain disruption
Boards need visibility into whether risk is within acceptable tolerance levels.
Compliance Dashboards
Strong compliance dashboards provide:
- Regulatory compliance status by framework (ISO, SOC, GDPR, HIPAA, NIST, etc.)
- Open compliance gaps and remediation timelines
- High-risk non-conformities
- Policy exceptions and approvals
- Control effectiveness scores
Instead of showing “X controls tested,” dashboards should show:
- % of critical controls failing
- Regulatory exposure rating
- Likelihood of enforcement risk
Compliance should be framed as exposure management — not checkbox fulfillment.
Audit & Control Metrics
- Audit findings by severity
- Repeat findings trend analysis
- Time to remediation
- Control failure rate
- Assurance coverage across critical assets
A powerful board dashboard highlights systemic weaknesses, not isolated issues.
Cyber & Technology Risk Indicators
Given the increasing cyber risk landscape, boards expect visibility into:
- Vulnerability exposure trends
- Critical patch delays
- Third-party risk scoring
- Incident response maturity
- Data classification and protection metrics
These must be presented in business impact language — not technical jargon.
Operational & Resilience Indicators
- Business continuity testing results
- Disaster recovery readiness
- Vendor risk concentration
- Critical process uptime
- Crisis simulation outcomes
These shifts report from reactive compliance to resilience assurance.
Aligning GRC KPIs with Business Objectives
Metrics without context lack meaning.
For example:
- A “medium risk” in a non-critical system is manageable.
- A “medium risk” in a revenue-generating platform may be unacceptable.
Effective GRC dashboards for board reporting align KPIs to:
- Strategic initiatives
- Revenue streams
- Market expansion plans
- Digital transformation projects
- M&A activities
Alignment questions to consider:
- Which risks threaten our growth strategy?
- Which compliance obligations impact our market access?
- Which control weaknesses could affect valuation?
When risk dashboards for boards reflect business objectives, conversations shift from operational status updates to strategic decisions.
Designing Effective Risk Dashboards for Leadership
Design determines the impact.
Visualizing Risk Trends and Exposure
Effective dashboards use:
- Heat maps for exposure distribution
- Trend lines for risk trajectory
- Risk appetite gauges
- Traffic-light indicators for remediation status
- Comparative quarter-over-quarter metrics
Visualization principles:
One-screen summary – A single executive snapshot.
Drill-down capability – Details available when required.
Color-coded risk levels – Immediate interpretation.
Narrative commentary – Context behind numbers.
The goal of GRC reporting for executives is decision enablement, not data presentation.
A well-designed dashboard answers in seconds:
- Where are we exposed?
- What is deteriorating?
- What needs attention now?
Avoiding Data Overload in Top Management Dashboards
One of the most common mistakes is overloading dashboards with excessive metrics.
Best practices include:
- Limit to 10–15 strategic KPIs
- Group metrics by risk category
- Separate operational dashboards from board dashboards
- Avoid technical abbreviations
- Use business impact language
Board dashboards should not include:
- Low-risk operational metrics
- Raw vulnerability counts without context
- Control activity logs
- Policy version histories
Clarity drives confidence.
When dashboards are concise and strategically aligned, reporting conversations becomes sharper and more action oriented.
How GRC Platforms Enable Executive Reporting
Technology is a critical enabler of modern board reporting.
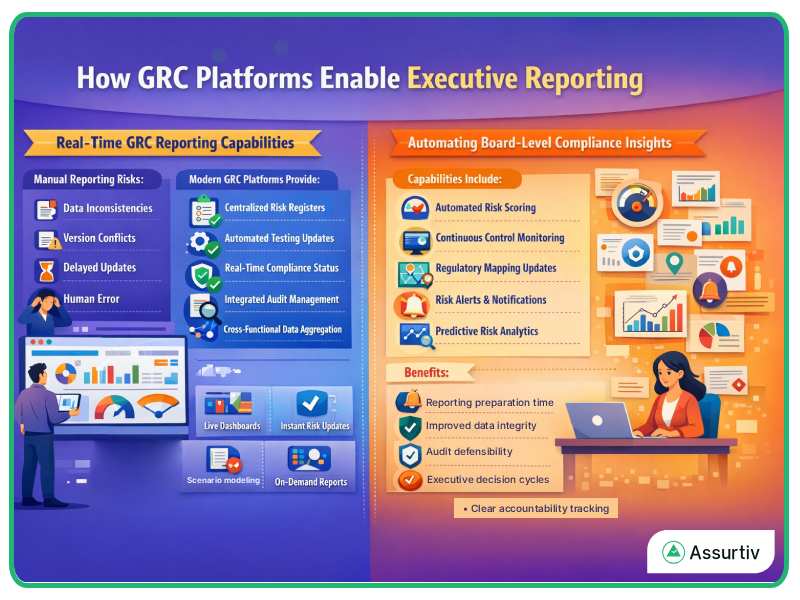
Real-Time GRC Reporting Capabilities
Manual reporting introduces risk:
- Data inconsistencies
- Version conflicts
- Delayed updates
- Human error
Modern GRC platforms provide:
- Centralized risk registers
- Automated control testing updates
- Real-time compliance status
- Integrated audit management
- Cross-functional data aggregation
This enables:
- Live dashboards
- Instant risk posture updates
- On-demand board reports
- Scenario modeling
Instead of quarterly reporting surprises, oversight becomes continuous and transparent.
Automating Board-Level Compliance Insights
Automation strengthens confidence and reduces reporting friction.
Capabilities include:
- Automated risk scoring
- Continuous control monitoring
- Regulatory mapping updates
- Alerting when risk appetite is breached
- Predictive analytics on risk trends
With automation, compliance dashboards evolve from static summaries into dynamic oversight tools.
Benefits include:
- Reduced reporting preparation time
- Improved data integrity
- Increased audit defensibility
- Faster executive decision cycles
- Clear accountability tracking
When GRC platforms are properly implemented, dashboards shift from reactive documentation tools to proactive governance enablers.
Building a Board-Level GRC Dashboard Framework
To implement an effective dashboard strategy:
Step 1: Define Risk Appetite and Thresholds
Without defined tolerance levels, dashboards lack meaning.
Step 2: Identify Critical Business Drivers
Map risks and compliance obligations to strategic objectives.
Step 3: Select Material KPIs
Focus only on high-impact metrics.
Step 4: Integrate Data Sources
Unify risk, audit, compliance, IT, and operational inputs.
Step 5: Design Executive-Focused Visualizations
Keep reporting strategic, concise, and impact oriented.
Step 6: Automate Reporting Cycles
Leverage GRC technology for real-time oversight.
The Strategic Impact of GRC Dashboards
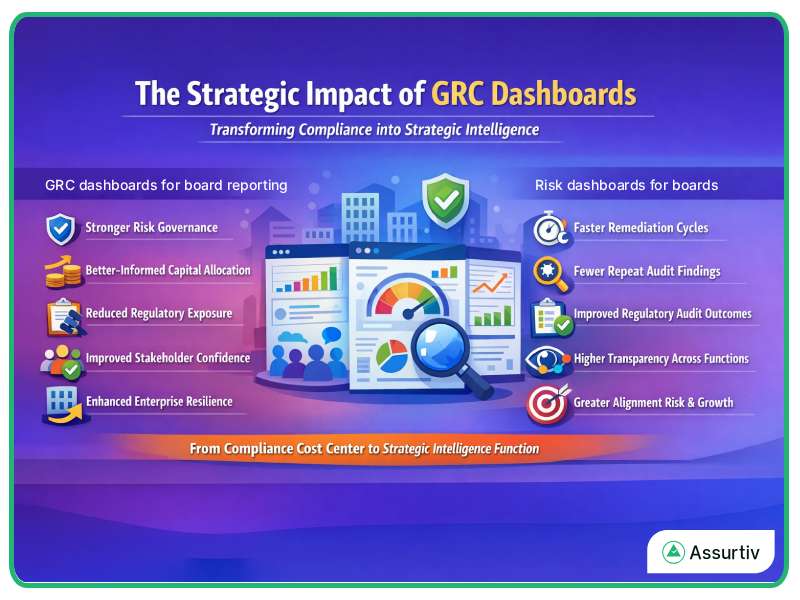
Well-designed GRC dashboards for board reporting create measurable value:
- Stronger risk governance
- Better-informed capital allocation
- Reduced regulatory exposure
- Improved stakeholder confidence
- Enhanced enterprise resilience
They transform GRC from a compliance cost center into a strategic intelligence function.
Organizations that mature their risk dashboards for boards typically see:
- Faster remediation cycles
- Fewer repeat audit findings
- Improved regulatory audit outcomes
- Higher transparency across functions
- Greater alignment between risk and growth
Future of GRC Reporting for Executives
As regulatory complexity and cyber risk increase, reporting expectations will intensify.
Emerging trends include:
- AI-powered risk prediction
- Continuous compliance monitoring
- ESG risk integration
- Third-party risk visualization
- Real-time board reporting portals
The future of GRC reporting for executives is not static reporting decks. It is interactive, predictive, and integrated governance intelligence.
Organizations that invest in dashboard maturity today will lead to tomorrow’s governance standards.
Frequently Asked Questions (FAQs)
What is a GRC dashboard?
A GRC dashboard is a centralized reporting interface that displays governance, risk, compliance, and audit metrics in a structured format for executive oversight and strategic decision-making.
Why are GRC dashboards important for board reporting?
GRC dashboards provide visibility into enterprise risk exposure, compliance status, and control effectiveness, enabling informed decisions and proactive governance.
What metrics should be included in board-level risk dashboards?
Board-level risk dashboards should include top enterprise risks, compliance exposure, audit findings, risk appetite alignment, cyber risk indicators, and remediation progress.
How do GRC dashboards improve executive decision-making?
They transform fragmented operational data into consolidated insights aligned with business objectives, allowing faster, data-driven decisions.
What is the difference between operational and board GRC dashboards?
Operational dashboards track detailed control activities, while board dashboards focus on strategic risk exposure, material compliance gaps, and high-level KPIs.
Conclusion
Effective governance requires visibility. Visibility requires structure. And structure requires intelligent dashboards.
GRC dashboards for board reporting are no longer optional tools — they are strategic necessities. They unify risk, compliance, audit, and operational insights into decision-ready intelligence.
When designed around material board reporting risk metrics, aligned with business objectives, and powered by modern GRC platforms, these dashboards elevate governance conversations.
The question is no longer whether dashboards should exist.
The real question is:
Are they enabling confident, informed decisions — or simply reporting activity?
Organizations that answer this correctly will strengthen oversight, reduce exposure, and position GRC as a core driver of sustainable growth.